How to View Response Headers Using Developer Tools in Chrome and Firefox
Response headers contain critical information about an HTTP response, such as the Request URL, Remote Address, Cache Control headers, Content Type and many other details. You can easily inspect these headers using the built-in developer tools in Google Chrome and Mozilla Firefox. Follow the steps below to access them.
Google Chrome
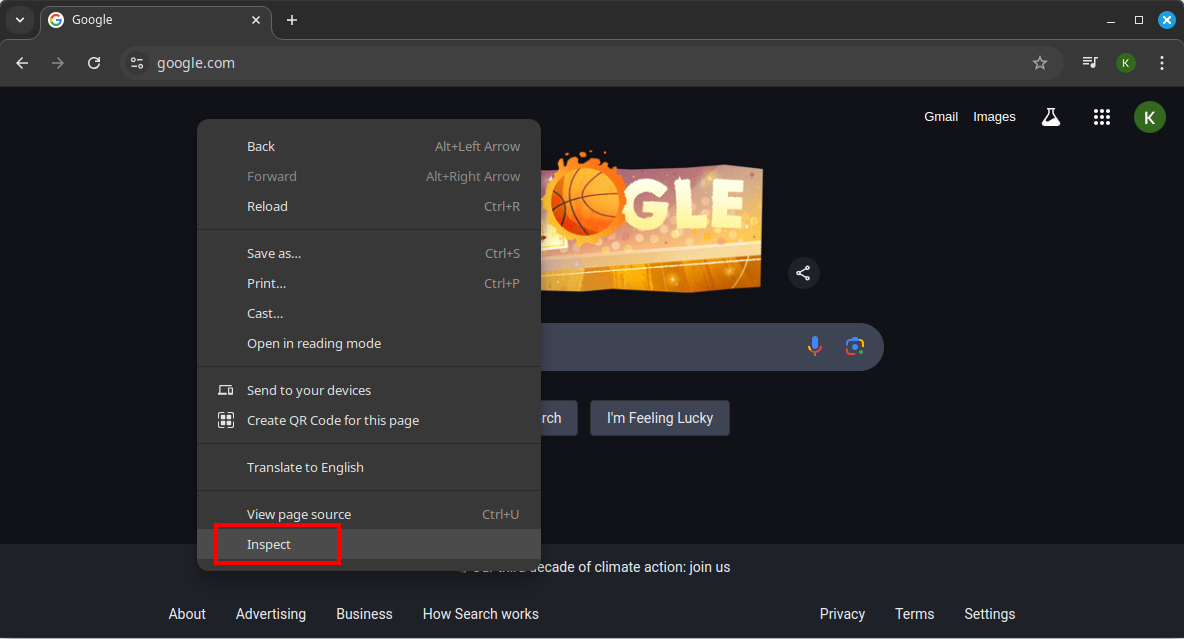
- Open Developer Tools:
- Right-click anywhere on a webpage and select Inspect, or press Ctrl+Shift+I (Windows/Linux) or Cmd+Option+I (Mac).
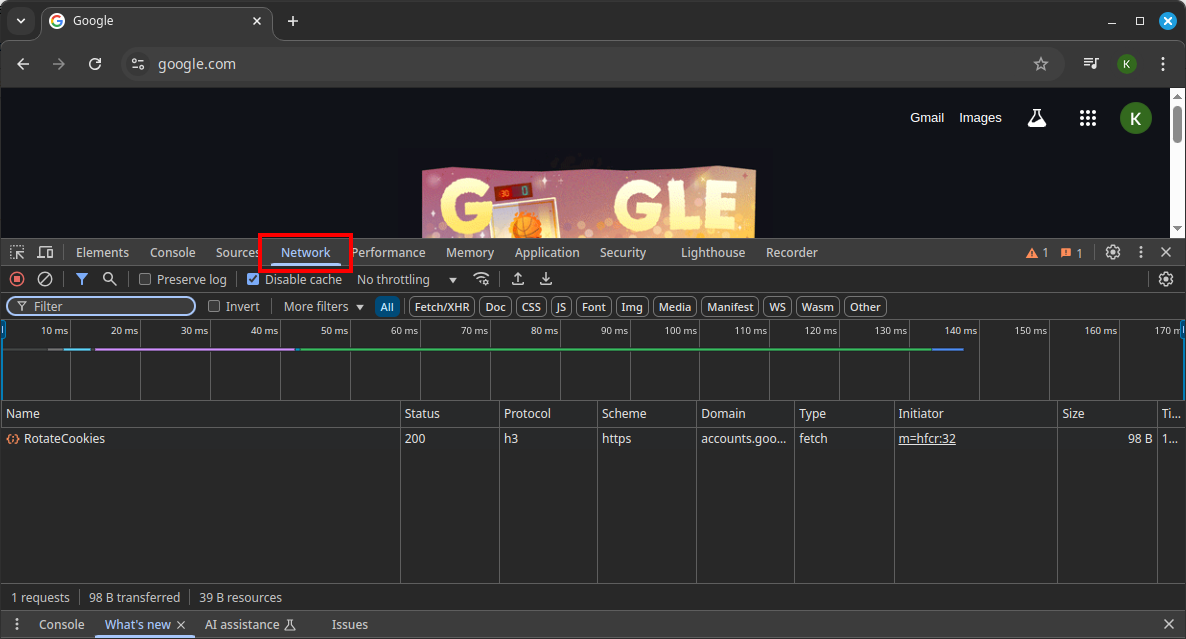
- Navigate to the Network Tab:
- In the Developer Tools panel, click the Network tab. If you don’t see it, ensure the panel is wide enough or click the three-dot menu to enable it.
- Reload the Page:
- Refresh the page (Ctrl+R or Cmd+R) to capture network activity. The Network tab will populate with a list of requests.
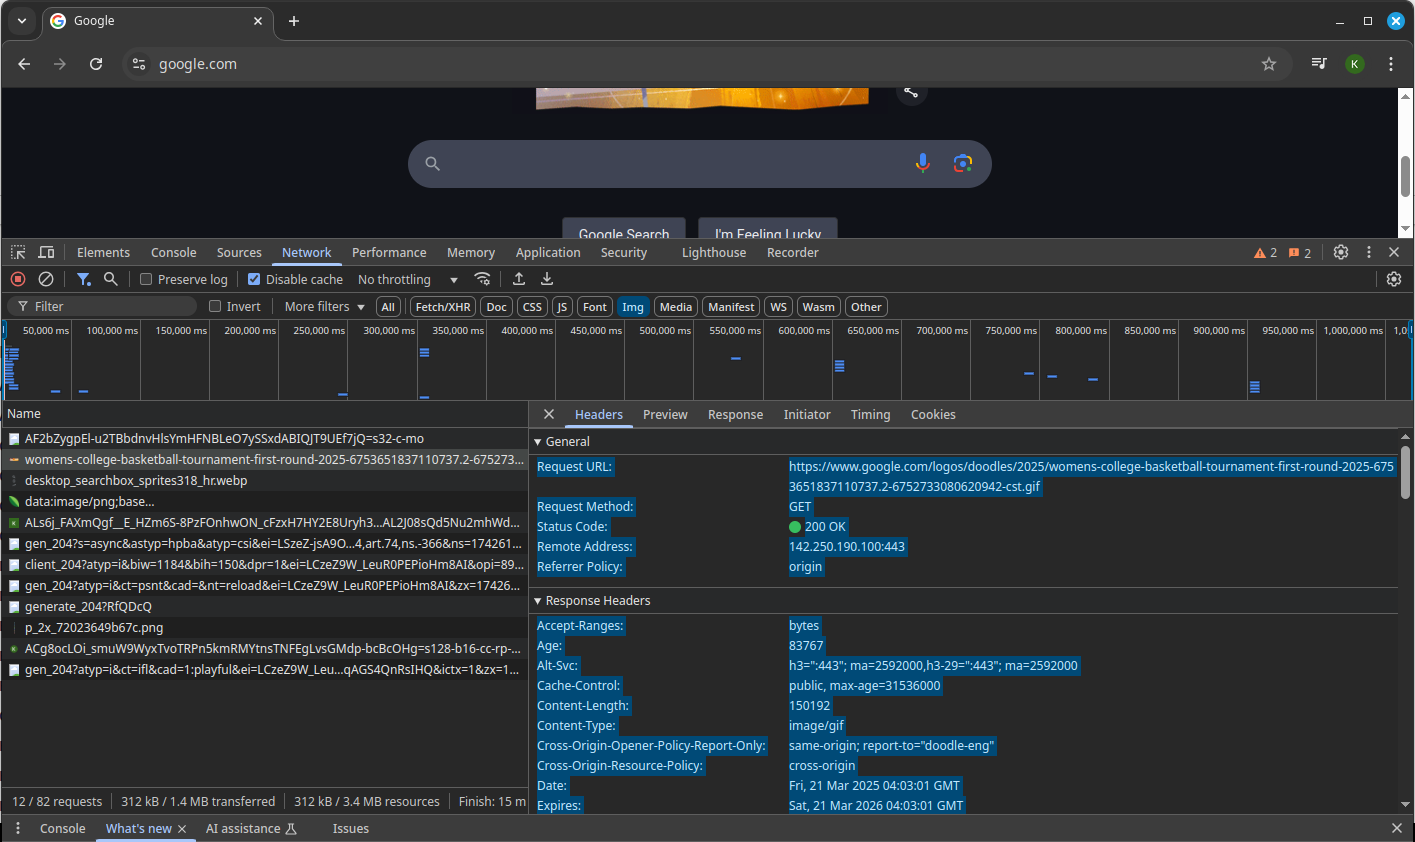
- Select a Request:
- In the list, click on a specific request (a failing CDN request for example) to view its details.
- View Response Headers:
- In the right-hand pane, click the Headers tab (if not already selected).
- Select all of the lines in the General and Response Header sections.
- Press Ctrl+C or Cmd+C to Copy those headers to the clipboard. Then you can use Ctrl+V or Cmd+V to paste those headers in a message to us.
Tip: Use the filter bar (e.g., type "doc" to show only document requests) to narrow down the list.
Mozilla Firefox
- Open Developer Tools:
- Right-click on a webpage and select Inspect, or press Ctrl+Shift+E (Windows/Linux) or Cmd+Option+E (Mac).
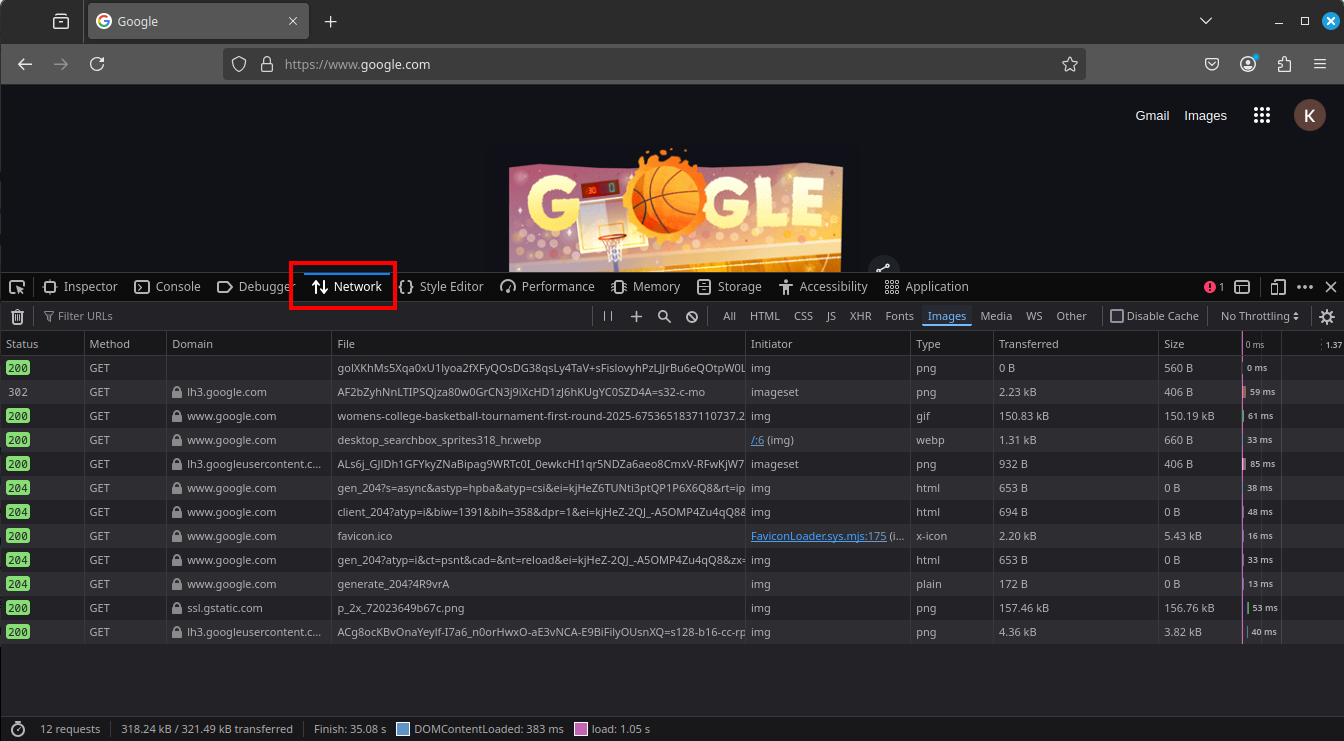
- Go to the Network Tab:
- Click the Network tab in the Developer Tools panel.
- Reload the Page:
- Refresh the page (F5 or Cmd+R) to log network requests. The tab will display all requests made by the page.
- Select a Request:
- Click on a request from the list (a failing CDN request for example).
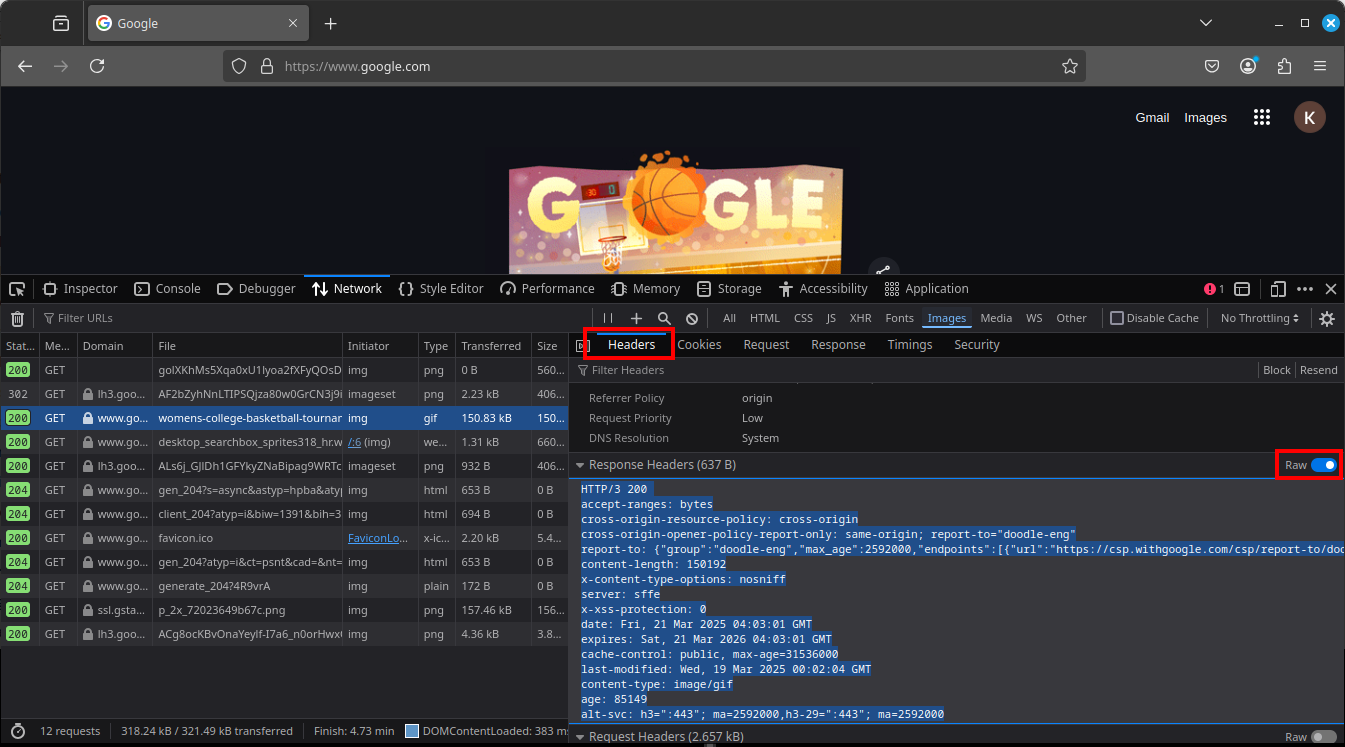
- View Response Headers:
- In the right-hand panel, select the Headers tab. The Response Headers section will display crucial details. You can select the "Raw" option to get a list that will be easier to Copy and Paste.
- Select all of the lines in the Response Header section.
- Press Ctrl+C or Cmd+C to Copy those headers to the clipboard. Then you can use Ctrl+V or Cmd+V to paste those headers in a message to us.
Tip: You can also Right-click a request and select Copy Value, and then Copy Response Headers to copy them to your clipboard.
Notes
- Ensure the webpage is fully loaded or trigger the specific action (e.g., clicking a button) to capture dynamic requests.
- If requests don’t appear, check if the “Persist Logs” or “Disable Cache” options are enabled in the Network tab settings for continuous logging.
By following these steps, you can efficiently inspect response headers in Chrome or Firefox to assist us in our analysis and debugging processes.
